The Wonderland of Dynamic Tracing (Part 2 of 3)
This is Part 2 of the series “The Wonderland of Dynamic Tracing” which consists of 3 parts. I will keep updating this series to reflect the state of art of the dynamic tracing world.
The previous one, Part 1, introduced the concept of dynamic tracing on a very high level and the two open-source dynamic tracing frameworks, DTrace and SystemTap. This part will first take a close look at Flame Graphs which were frequently mentioned in the previous part, then introduce the common methodologies used in troubleshooting processes involved in dynamic tracing.
Flame Graphs
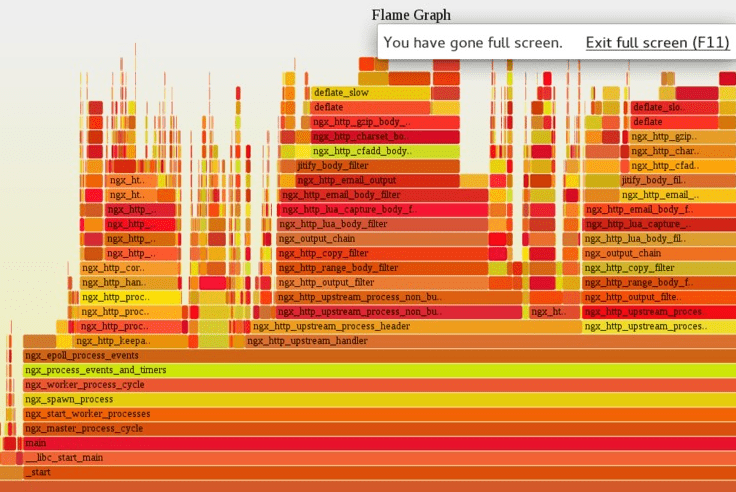
Flame Graphs have appeared many times in the previous part of this series. So what is it? Flame Graphs are a kind of amazing visualization, presumably invented by Brendan Gregg, of whom I already made repeated mentions before.
Flame Graphs function like X-ray images of a running software system. The graph integrates and displays time and spatial information in a very natural and vivid way, revealing a variety of quantitative statistical patterns of system performance.
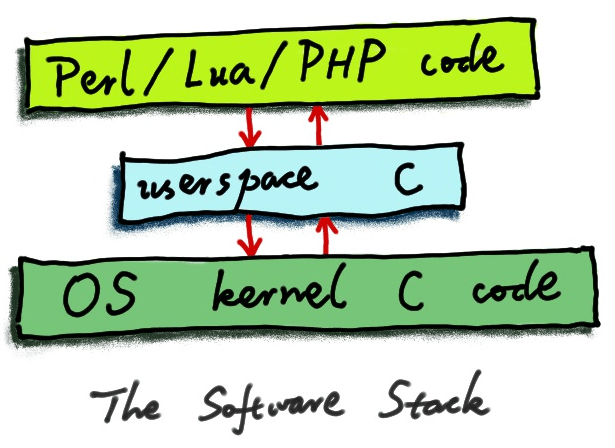
I shall start with an example. The most classical kind of flame graphs looks at the distribution of CPU time among all code paths of the target running software. The resulting distribution diagram visibly distinguishes code paths consuming more CPU time from those which consume less. Furthermore, the flame graphs can be generated on different software stack levels, say, drawing a graph on the C/C++ language level of systems software, and then drawing a flame graph on a higher level, like the dynamic scripting language level, like Lua and Python code. Different flame graphs often offer different perspectives, reflecting level-specific code hot spots.
In dealing with the mailing lists of OpenResty, my own open-source software community, I often encourage users to proactively provide the flame graphs they sample when reporting a problem. Then the graph will work its magic to quickly reveal all the bottlenecks to everyone who sees it, saving all the trouble of wasting time on endless trials-and-errors. It is a big win for everybody.
It is worth noting that in the case of an unfamiliar program, the flame graph still makes it possible to gain a big picture of any performance issues, without the need of reading any source code of the target software. This capability is really marvelous, thanks to the fact that most programs are made to be reasonable or understandable, at least to some extend, meaning that each program already uses abstraction layers at the time of software construction, for example, through functions or class methods. The names of these functions usually contain semantic information and are directly displayed on the flame graph. Each name serves as a hint of what the corresponding function does, and even a hint for the corresponding code path as well. The bottlenecks in the program can thus be inferred. So it still comes down to the importance of proper function or module naming in the source code. The names are not only crucial for humans to read the source code, but also very helpful when debugging or profiling the binary programs. The flame graphs, in turn, also serve as a shortcut to learning unfamiliar software systems. Thinking it the other way, important code paths are almost always those taking up a lot of time, and so they deserve special attention; otherwise something must be very wrong in the way the software is constructed.
The most classical flame graphs focus on the distribution of CPU time across
all code paths of the target software system currently running. This is the
CPU time dimension. Naturally, flame graphs can also be extended to other dimensions,
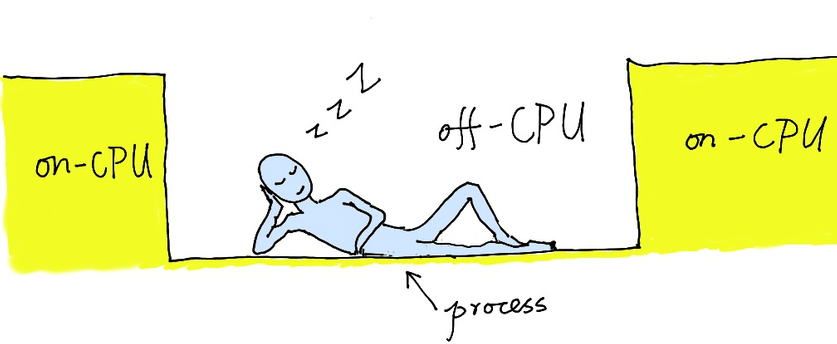
like off-CPU time, when a process does not run on any CPU cores. Generally speaking,
off-CPU time exists because the process could be in a sleeping state for some
reasons. For example, the process could be waiting for certain system-level
locks, for some blocking I/O operations to complete, or is just running out
of the current CPU time slice assigned by the process scheduler of the operating
system. All such circumstances would prevent the process from running on any
CPU cores, but a lot of wall clock time is still taken. In contrast with the
CPU time dimension, the off-CPU time dimension reveals invaluable information
to analyze overhead of the system locking (such as the system call sem_wait
), some blocking I/O operations (like open and read ), as well as the CPU
contention among processes and threads. All become very obvious with off-CPU
flame graphs with getting overwhelmed by too many details which do not really
matter.
Technically speaking, the off-CPU flame graph was the result of a bold attempt.
One day, I was reading Brendan’s blog article
about off-CPU time, by Lake Tahoe straddling the California-Nevada border. A
thought struck me: maybe off-CPU time, like CPU time, can be applied to the
flame graphs. Later I tried it in my previous employers' production systems,
sampling the off-CPU flame graph of the nginx processes using SystemTap. And
I made it! I tweeted about the successful story and got a warm response from
Brendan Gregg. He told me how he had tried it without desired results. I guess
that he had used the off-CPU graph for multi-threaded programs, like MySQL.
Massive thread synchronization operations in such processes will fill the off-CPU
graph with too much noises that the really interesting parts get obscured. I
chose a different use case, single-thread programs like Nginx or OpenResty.
In such processes, the off-CPU flame graphs can often promptly reveal blocking
system calls in the blocked Nginx event loops, like sem_wait, open, and
intervenes by the process scheduler. With these functions, it is of great help
for analyzing similar performance issues. The only noise will be the epoll_wait
system call in the Nginx event loop, which is easy to identify and ignore.
Similarly, we can extend the flame graph idea to other system resource metric dimensions, such as the number of bytes in memory leaks, file I/O latency, network bandwidth, etc. I remembered once I used the “memory leak flame graph” tool invented by myself for rapidly figuring out what was behind a very thorny leak issue in the Nginx core. Conventional tools like Valgrind and AddressSanitizer were unable to capture the leak lurking inside the memory pool of Nginx. In another situation, the “memory leak flame graph” easily located a leak in the Nginx C module written by a European developer. He had been perplexed by the very subtle and slow leak over a long period of time, but I quickly pinpointed the culprit in his own C code without even reading his source code at all. In retrospect, I think that was indeed like magic. I hope now you can understand the omnipotence of flame graph as a visualization method for a lot of entirely different problems.
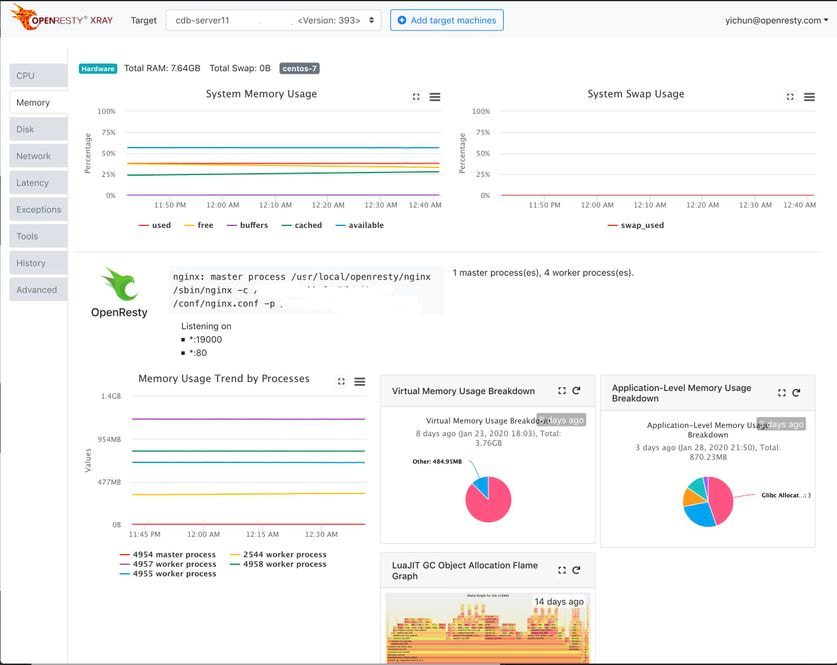
Our OpenResty XRay product supports automated sampling for various types of flame graphs, including the C/C++ level flame graphs, Lua level flame graph, off-CPU flame graphs, CPU flame graphs, dynamic memory allocation flame graph, GC object reference relationship flame graphs, file IO flame graphs, and many more!
Methodology
Flame graphs, the sampling-based visualization approach, could serve general purposes already. Choose one performance metric dimension, and then you get the corresponding flame graphs for analysis, regardless of the system and language used. Nonetheless, it is more common when we need to analyze and investigate deeper and more peculiar problems. This requires writing a series of dedicated dynamic tracing tools to get closer and closer to the root cause of the problem step by step.
During a tracing process, the strategy we recommend is “Gradatim Ferociter”, which means “Step by Step, Ferociously”. The strategy does not strive for writing a very large, very complicated universal debugging tool, and collecting all possibly necessary information, to get rid of the final problem once for all. Quite the opposite, it starts with breaking down assumptions about the problem to dig into and verify the sub-assumptions one by one. More definite details surfacing during the process will be a guide to the correct direction and prompt a continuous adjustment in earlier trajectories and assumptions until the problems get unveiled. Simply put, this debugging strategy involves simple tools, which have two advantages. One is that tools employed in each step and each phase can be simple enough so that the risk of making a mistake is significantly reduced. Brendan also acknowledged when he tried to write multi-purpose complex tools, they would be much more likely to carry bugs. However, wrong tools would offer wrong information, leading to wrong conclusions. This is very dangerous. The other advantage is that simple tools will incur relatively low overhead for the production system when samples are taken. They only introduce a relatively small number of probes and also avoid a lot of complicated calculations in the probe handlers. With a dedicated simple goal, each debugging tool is available for separate use and has a much higher chance of getting reused in the future. Therefore this debugging strategy delivers huge benefits just like the principle of “do one thing and do it well” in the UNIX world.
One paradigm that we would avoid at all costs is the so-called “big data” debugging approach, which seeks to gain as complete information and data as possible. While advancing each step in each phase, we only collect information truly needed by the current step. Each step is a task to prove or disprove the earlier conjecture or theory based on any newly gathered information and offers insight and clues for writing finer-grained tools in the next step.
Our approach to handling online events with a very low frequency is also entirely different from the conventional one – collecting full-amount statistical data as much as possible. We take a “lie in wait” attitude to wait for the probes to capture interesting events after setting a threshold or other screening conditions. An example is when tracking low-frequency long-latency requests, we first single out requests whose delays exceed certain thresholds through the debugging tools. Next, we inspect those requests only by gathering as much useful data from them as possible. Clear goals and concrete strategies would guide the sampling analysis very effectively, enabling us to minimize the tracing overhead without wasting any system resources unnecessarily.
With an advanced knowledge base and inference engines, OpenResty XRay can automatically employ various dynamic tracing strategies and systematically narrow down the scope of a potential problem until reaching the root cause.
Knowledge Is Power
An old saying goes that knowledge is power. The application of dynamic tracing is precisely another vivid example of that axiom.
Applying dynamic tracing is a journey to translate existing understanding and knowledge of software systems into very practical tools that can address real problems. Though the traditional computer science and engineering education in college has equipped engineers with concepts like virtual file systems, virtual memory systems, process schedulers, etc., these concepts are usually too abstract and too vague in common textbooks. But with dynamic tracing, they come alive and become concrete. For the first time, engineers have the chance to observe exactly how they operate and their statistical patterns in the real production system, without having to distort the source code of the operating system kernel or system software. It is dynamic tracing that has opened up a whole world of opportunities for such non-invasive real-time observations.
The interactive relationship between dynamic tracing technology and professional system knowledge can be better understood through an analogy. Let’s compare dynamic tracing technology to the Chinese heavy sword and professional system knowledge to sword-fight techniques. If a man knows nothing about such techniques, he definitely won’t be able to wield the sword. The more techniques he masters, the more skillful he will be in sword fighting. With perseverance, he will one day become a great master. Following the same logic, mastery of system knowledge will enable an engineer to wield the “sword” to solve some basic problems that had previously been unimaginable. The more he knows about the system, the better he wields the “sword”. And, very incredibly, any gain in knowledge will immediately pay off in tackling some new problems. So, more knowledge enhances the ability to problem-solving with debugging tools, and vice versa. By solving problems using the tools, an engineer will understand interesting statistical patterns, microscopic or macroscopic, of the production systems. The tangible experience will inject great momentum into the pursuit of more system knowledge. No wonder all aspiring engineers consider this a powerful weapon.
“Only tools that inspire engineers to always learn more are good tools,” one of my Weibo posts. Indeed, knowledge and tools mutually strengthen each other along the way.
Open-Source and Debug Symbols
We already know that dynamic tracing turns a running software system into a read-only database that can be queried in real-time. But usually, this is only possible when the software system has relatively complete debug symbols. Then, what are debug symbols? Debug symbols are generally meta-information generated by the compiler for debugging purposes when software is compiled. This information can map a lot of information details from the compiled binary program, e.g. the address of functions and variables, and memory layout of data structure, back to names of abstract entities in the source code, like function name, variable name, and type name. In the Linux world, the common format of debug symbols is DWARF (debugging with attributed record formats). These debug symbols create a map for the binary world. The map acts as a beacon to help interpret and uncover the semantic meaning behind subtleties in the underlying world and reconstruct high-level abstract concepts and relationships.
Normally, debug symbols are easy to create only in open-source software. For confidentiality concerns, most closed-source software does not provide any debug symbols to make reverse engineering and cracking more difficult. Some may have heard of Integrated Performance Primitives (IPP), a software library from Intel. IPP offered Intel chips a range of optimized implementations of common algorithms. We ever tried to use the IPP-based gzip compression library on a production system. Unfortunately, we ran into trouble – IPP broke down online from time to time. It is a great pain to debug closed-source software without debug symbols. Many teleconferences with Intel engineers failed to help identify and address the trouble, we finally had to give up. The debugging might become much easier if source code or debug symbols were available.
In a sharing session, Brendan Gregg also pointed out the close connection between open source and dynamic tracing. This is especially true when the entire software stack is open source, which is the precondition for maximizing the power of dynamic tracing. A typical software stack includes an operating system kernel, various kinds of system software, and higher-level advanced language programs. When the entire stack is fully open source, we can easily get the information we want from all software layers, and transforming it into knowledge and into an action plan will be a piece of cake.
Complicated dynamic tracing must rely on debug symbols. However, some C compilers would create problematic symbols. These debugging messages containing errors would make a huge dent in the effect of dynamic tracing and even directly hamper analysis. A widely used C compiler called GCC, for example, did not have high-quality debug symbols until Version 4.5. But it has improved considerably since then, especially when compiler optimizations are available.
OpenResty XRay dynamic tracing platform captures debug symbol packets and binary packets of familiar open-source software on the public networks in real-time and analyzes and indexes them. So far, the database has indexed almost 10 TB of data.
Conclusion
This part of the series has a close look at Flame Graphs and covers the methodology commonly used in the troubleshooting process involved with dynamic tracing technologies. The next part, Part 3, will look at the Linux kernel support needed by dynamic tracing, as well as some other more exotic tracing needs like tracing hardware and “corpses” of dead processes and traditional debugging technologies and the modern dynamic tracing world in general.
A Word on OpenResty XRay
OpenResty XRay is a commercial dynamic tracing product offered by our OpenResty Inc. company. We use this product in our articles like this one to intuitively demonstrate implementation details, as well as statistics about real-world applications and open-source software. In general, OpenResty XRay can help users to get deep insight into their online and offline software systems without any modifications or any other collaborations, and efficiently troubleshoot really hard problems for performance, reliability, and security. It utilizes advanced dynamic tracing technologies developed by OpenResty Inc. and others.
You are welcome to contact us to try out this product for free.
About The Author
Yichun Zhang (Github handle: agentzh), is the original creator of the OpenResty® open-source project and the CEO of OpenResty Inc..
Yichun is one of the earliest advocates and leaders of “open-source technology”. He worked at many internationally renowned tech companies, such as Cloudflare, Yahoo!. He is a pioneer of “edge computing”, “dynamic tracing” and “machine coding”, with over 22 years of programming and 16 years of open source experience. Yichun is well-known in the open-source space as the project leader of OpenResty®, adopted by more than 40 million global website domains.
OpenResty Inc., the enterprise software start-up founded by Yichun in 2017, has customers from some of the biggest companies in the world. Its flagship product, OpenResty XRay, is a non-invasive profiling and troubleshooting tool that significantly enhances and utilizes dynamic tracing technology. And its OpenResty Edge product is a powerful distributed traffic management and private CDN software product.
As an avid open-source contributor, Yichun has contributed more than a million lines of code to numerous open-source projects, including Linux kernel, Nginx, LuaJIT, GDB, SystemTap, LLVM, Perl, etc. He has also authored more than 60 open-source software libraries.
Translations
We provide a Chinese translation for this article on blog.openresty.com ourselves. We also welcome interested readers to contribute translations in other natural languages as long as the full article is translated without any omissions. We thank them in advance.

