Ylang: Universal Language for eBPF, Stap+, GDB, and More (Part 1 of 4)
This post is the 1st part of the series “Ylang: Universal Language for eBPF+, Stap+, GDB, and More.” See also Part 2, Part 3, and Part 4.
Y or Ylang is a universal dynamic tracing language that targets various dynamic tracing frameworks and toolchains. We provide it as part of the OpenResty XRay platform developed by OpenResty Inc.
What is Dynamic Tracing
Dynamic tracing is a set of technologies that can analyze, troubleshoot, and profile live software systems in a safe, real-time, postmortem, efficient, and non-invasive way.
Many APM-like technologies claim to be non-invasive, but they still require collaborations from the target processes and applications. For example, they may require loading special modules and libraries, injecting new code into the target processes, or requiring them to emit data via API calls or log files.
I used to write a series of articles on dynamic tracing in general. It is titled “The Wonderland of Dynamic Tracing.” You’re welcome to check it out.
Why the “Y” Name
You may wonder why the language is called Y. It was a name given by Matthew Prince, the CEO of Cloudflare when I was still working there. He said it is the first letter of my first name, Yichun, and more importantly, it dubs the word “why,” where dynamic tracing languages often aim to answer complex questions starting with the word “why.” At that time, Ylang was still a very vague idea. After I founded OpenResty Inc. years later, I chose to keep the name, and I’d thank Matthew for It.
Getting Started
The Hello World Example
Let’s do the classic “hello world” example for the Y language:
$ run-y -e '_probe _oneshot { printf("Hello, world!\n"); }'
Start tracing...
Hello, world!
The run-y utility is from OpenResty XRay’s packages.
Here the _probe keyword defines a new probe handler for the special probe-point _oneshot, triggered when the analyzer starts up. And when the _oneshot probe completes execution, the analyzer quits immediately. The printf() function is just like the standard C counterpart.
Specifying Target Processes
The special _oneshot probe is a great way to experiment with the Y language features. We will see more examples later in this series. We usually use other kinds of probes for real-world analyzers like function probes, system call probes, process scheduler probes, CPU profiler probes, and many more. In those cases, we can specify an already running target process via its PID, as in
# assuming the target process has the PID 5786
run-y -p 5786 my-tool.y
Or we can specify a process group ID (PGID), as in
# assuming the target process group has the same group ID, 14927
run-y -p -14927 my-tool.y
If a live process with a PID equals the specified process group ID, our toolchain will automatically get the real process group ID from that process. It is convenient to specify the Nginx master process to trace the whole Nginx process group where the master process’s PID is not the same as the process group ID (when the daemon mode is enabled).
If we want to trace the whole lifetime of a program right from the startup, then we should use the -c option to start the processes with the run-y tool, as in
run-y -c '/usr/bin/perl -e1' my-tool.y
Here we are tracing the perl command’s entire lifetime. It ensures that we won’t miss early probes like those on the main function entry.
The run-y utility traces the whole operating system by default when both options -p and -c are not specified.
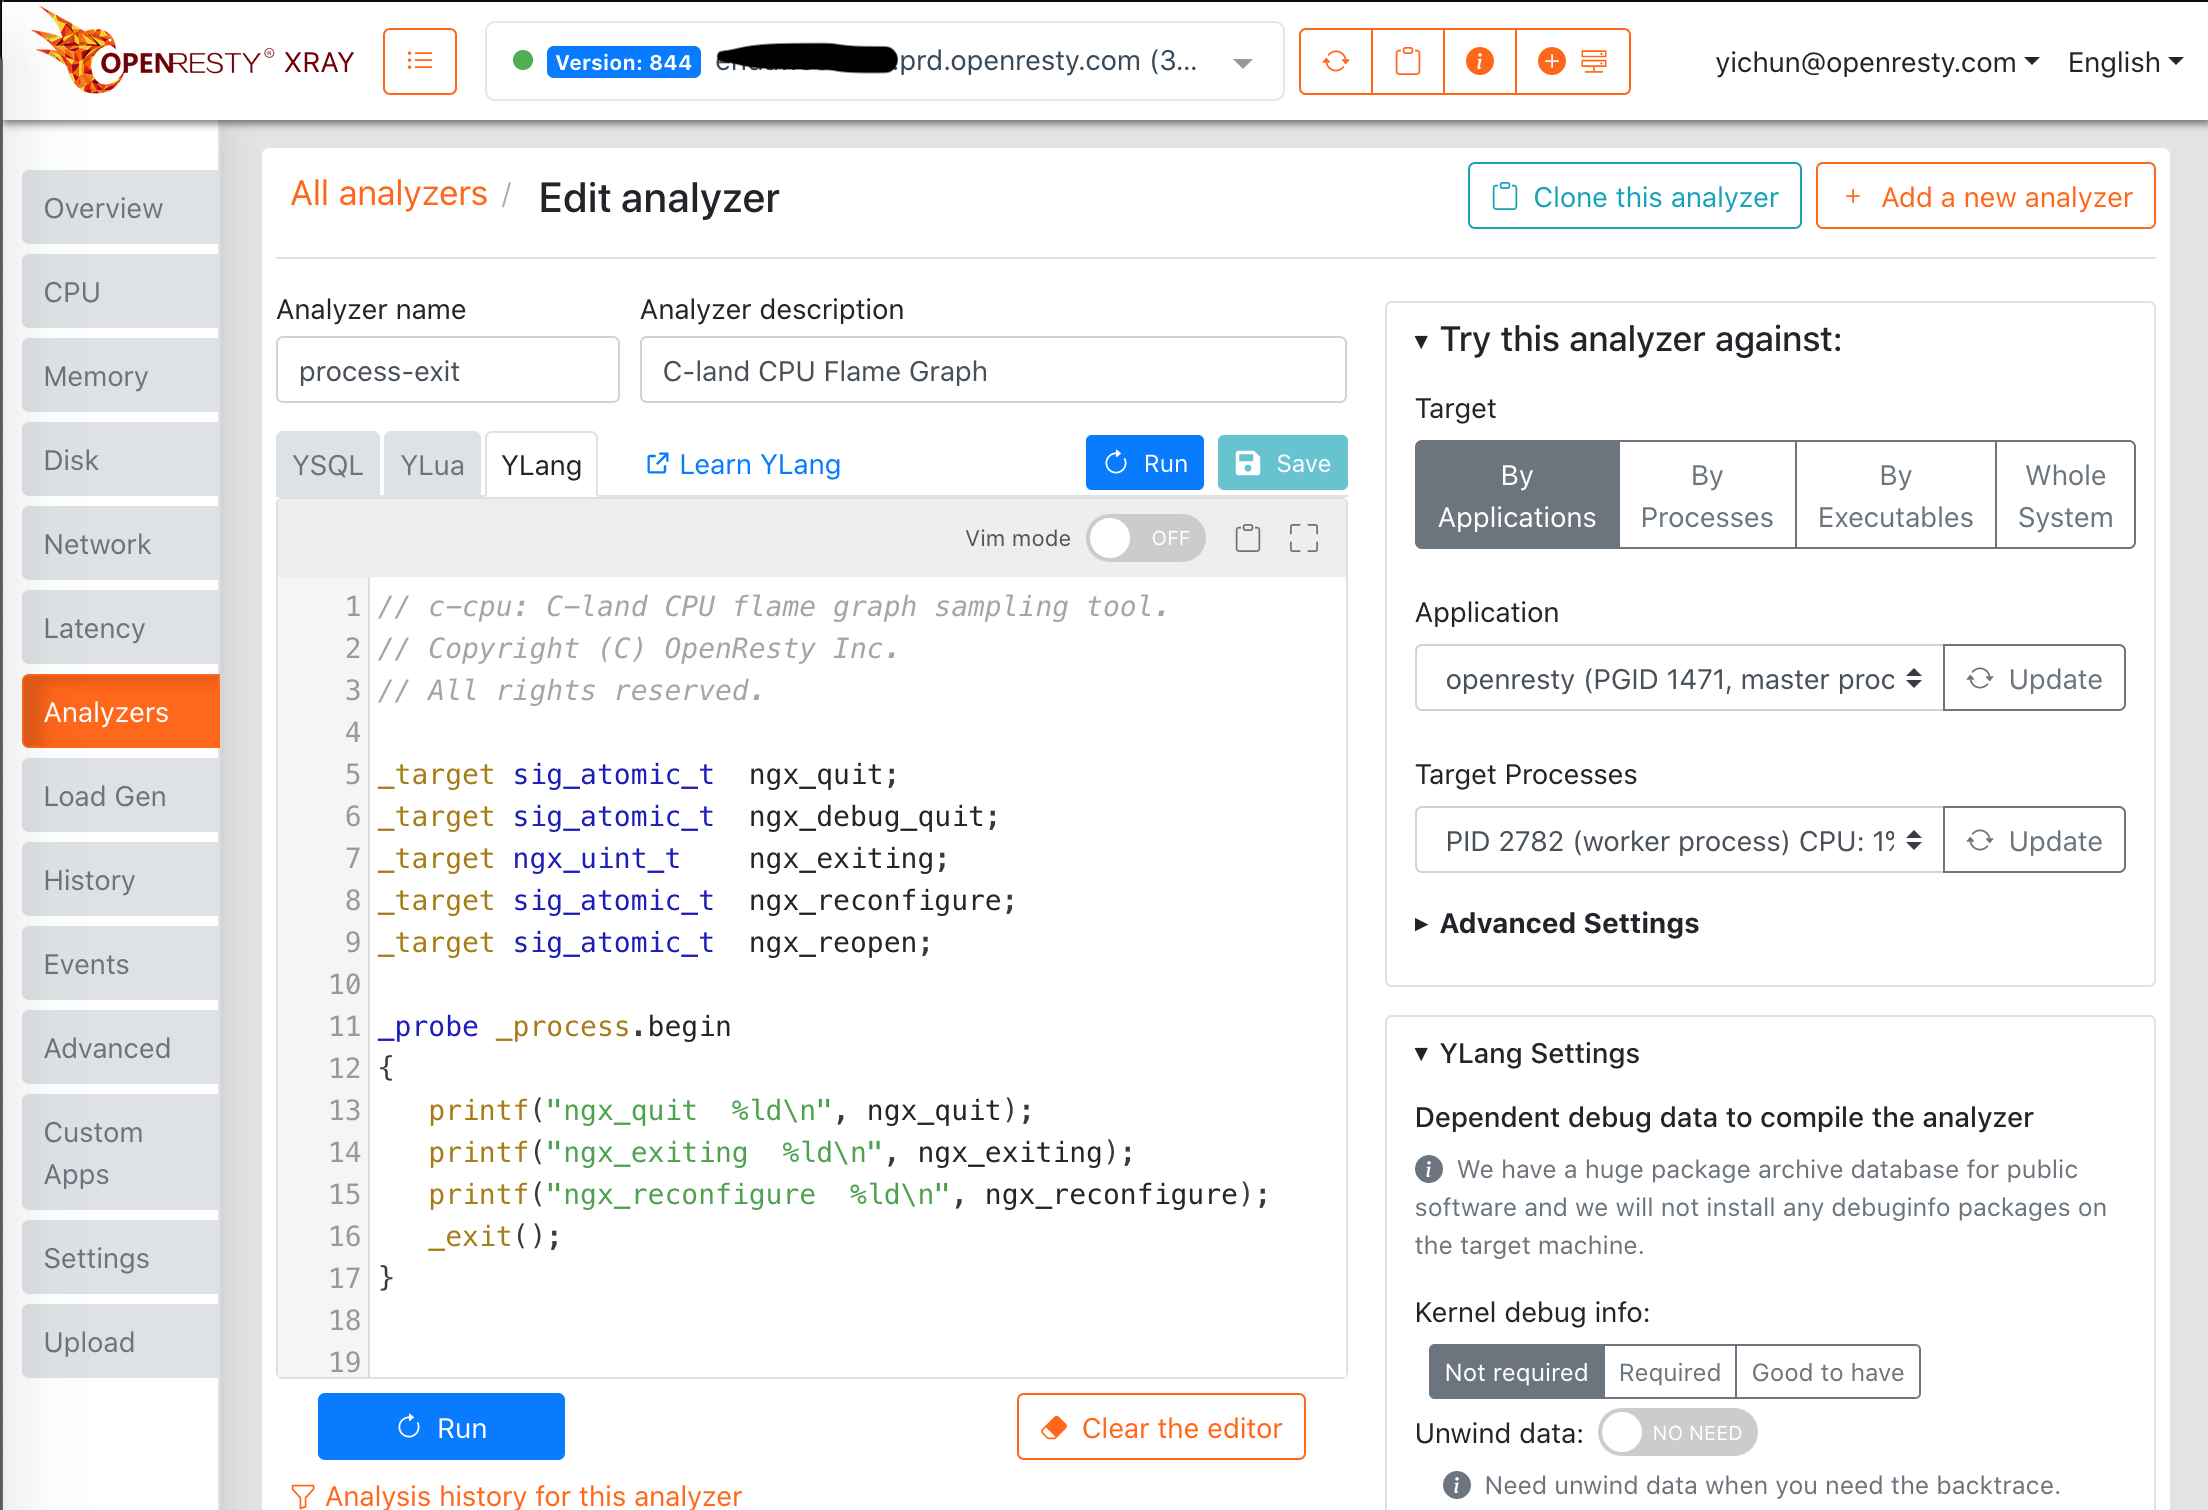
The Web Console
It is also possible to use the web console of OpenResty XRay to edit and run Ylang programs or analyzers. Below is a screenshot of the console.
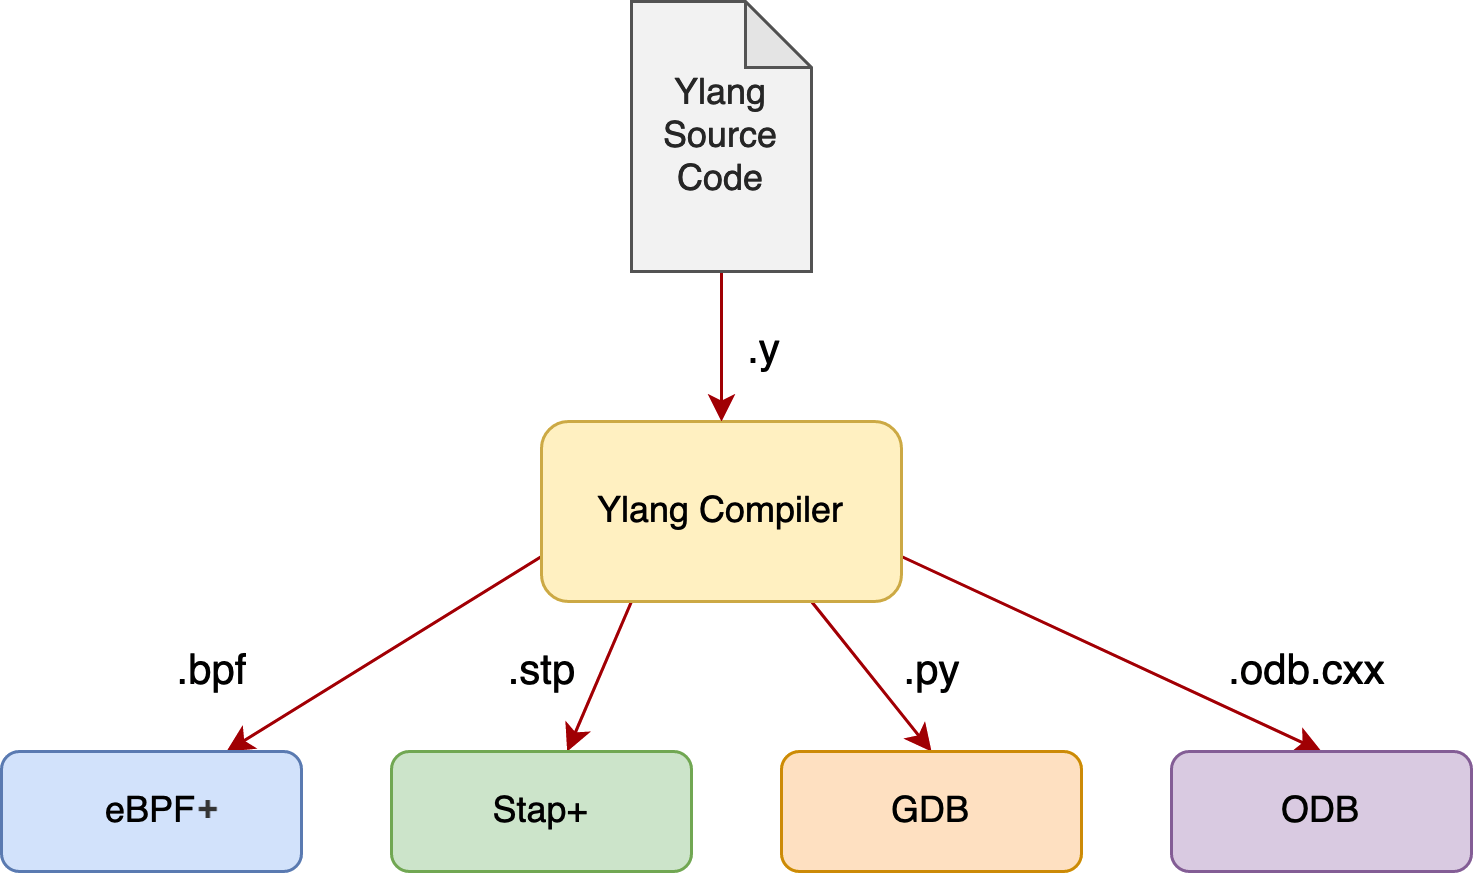
Various Backends and Runtimes
Currently, the following backends are supported:
- eBPF+ (our greatly improved implementation of the open-source eBPF VM and toolchain from Linux),
- Stap+ (our greatly enhanced version of the open-source SystemTap from Red Hat),
- GDB (the GNU Project Debugger) with its Python extension, and
- ODB (the OpenResty Debugger, similar to GDB, but orders of magnitude more lightweight)
Why do we need so many different debugging frameworks? That’s because each technology has its strengths and weaknesses and thus has various use cases. Let’s walk through them one by one:
- eBPF is a relatively new technology, so it usually requires newer Linux kernels. But it is much faster to compile and load tools than, say, SystemTap (with its default kernel runtime).
- Stap+ is similar to SystemTap. Both can work with a lot of kernel versions as far as CentOS 7’s 3.10 kernel (but don’t mistake it with the stock 3.10 kernel since Red Hat has back-ported tons of patches from newer kernels).
- GDB is the only backend that can analyze core dump files (from crashed processes). But still, it can use breakpoints to emulate function probes and dynamic tracing in general, just very slowly and costly.
- ODB is similar to GDB but has no historical baggage like GDB. It is still a pure user-land tracing framework but orders of magnitude faster than GDB. For some defective Intel Xeon CPUs, they may produce a lot of bogus page faults on totally valid memory access requests. In such cases, kernel-based dynamic tracing like eBPF and Stap+ often fail to read the memory of the target processes with page faults disabled. Thus ODB is the only choice on such chips.
More backends are planned, like LLVM’s LLDB (via its Python extension API, just like GDB) and the crash utility for analyzing kernel dump (kdump) files for crashed Linux kernels.
Usually, OpenResty XRay will automatically choose or re-choose the suitable backend for the current use cases and context. But it is also possible for the user to select a particular runtime explicitly.
Why a Unified Frontend Language
Ylang is a unified frontend language targeting any concrete debugging and dynamic tracing frameworks. It provides tremendous benefits of code reuse for different use cases mentioned above. A single Ylang tool can immediately work across various technologies and frameworks, serving many purposes like online tracing, core dump file analysis, and many more. The Ylang compiler makes sure the semantics are preserved exactly across dramatically different backends, saving a lot of human effort.
The Language Syntax
Ylang extends a massive subset of the C language with syntax and primitives for dynamic tracing. So C programmers should find it very easy to use. Ylang tries to be genuinely compatible with C (or even part of GNU C) to even very subtle levels. Indeed, we can take many real-world C code snippets as perfectly valid Ylang code without any edits. After all, so many open-source programs and libraries are in C, from databases like MySQL and PostgreSQL to advanced language interpreters and compilers like CPython, Ruby, Perl, and PHP. Even the Linux kernel is in C. C++ code can also be converted to C via a C++-to-C compiler. Thus, all those C++ open-source projects like Chromium, Qt, JVM, and NodeJS can also be a source of code for new Ylang analyzers and tools.
Why is using the same language as the target software essential? Because every time we want to create a new analyzer for a target application, the most tedious and laborious part in writing such tools is to walk around the data structures in the target. But the target applications must use these data structures themselves, so it’s natural to directly borrow their proven code to collect the information we need. The ability to do simple copy&paste dramatically reduces the cost of creating new dynamic tracing tools and analyzers.
In addition to Ylang for C-style coding, OpenResty XRay also provides compilers for other languages targeting Ylang, like YLua in the Lua syntax and YSql in the SQL syntax. We’ll cover these languages in future posts. More language flavors are planned, like Y variants for Python, Ruby, Java, Rust, Go, and many more.
Languages Used by Other Toolchains
Stap/D/Bpftrace: Like C but never C
Other open-source frameworks like DTrace, SystemTap, and Bpftrace (targeting eBPF) all introduce scripting languages of their own. Unfortunately, these languages only look like C and never aim to be genuinely compatible with C. So copy&paste existing C code from the target applications will never work. Significant effort is needed to port the code over to these frameworks' scripting languages. Testing the correctness and debugging of any bugs in the ported tools can also be challenging when the tools' logic is nontrivial.
It may not even look like C to real C programmers. Let’s take SystemTap’s script language as an example. Consider the following Ylang code snippet:
_target long *my_var;

int get_val(void) {
    return *(int *) my_var;
}
This snippet looks like perfectly valid C program except the special _target keyword which is an extension introduced by Ylang. This keyword means the symbol being declared is from the target processes (or the tracee space). If we want to turn it into SystemTap’s script, it’ll look like this:
function get_val() {
    return @cast(@var("my_var", "/path/to/target/exe/file"), "int", "/path/to/target/exe/file")[0];
}
It’s very different and much more verbose. We have to hard-code the executable file path in the code or pass it in via macros.
The most significant pain point in these scripting languages is the lack of a C-style type system. You are usually stuck with a signed long int type for integers. You have to emulate all the subtle C integer type conversion and arithmetic semantics yourself, which can be very annoying and error-prone.
You can check out some of the real-world complex SystemTap scripts we wrote manually in these public GitHub repositories, openresty-systemtap-toolkit, and stapxx. Such scripting languages are usually weak, and we had to write a Perl wrapper to turn them into more useful command-line utilities. Some people prefer other more powerful scripting languages to write such wrappers, like Python and Bash.
With Ylang, however, the user only uses a single language that is C compatible. No ugly wrappers in other scripting languages are needed anymore.
eBPF: C But Way Harder than C
The official eBPF toolchain (including BCC) usually employs the natural C language via LLVM and Clang. Sadly this C also has many severe limitations, to name a few:
- User-defined function can only take up to 5 parameters1.
- Control-flow statements have many restrictions due to the static code analyzer in the Linux kernel’s eBPF verifier. This verifier also introduces high CPU overhead for large eBPF programs. Jumping backward and general loops are usually prohibited.
- Passing composite typed values (like struct and union values) via function return values and arguments are not allowed2.
- Relocations for data references across
.data,.rodata,.bss, and other similar data sections are not supported (yet)3. - There is no or very little built-in support for types defined in the target processes. So the user usually has to declare all the types manually herself.
- There is no built-in VMA tracker4 support, so the user must compute the virtual memory address herself, which can be very tedious and error-prone.
- The built-in stack unwinder never uses the target processes' unwinding tables or DWARF data and thus relies on disabling the frame pointer registers when compiling the target processes.
- The runtime lacks any built-in memory allocations and management mechanisms beyond BPF Maps and stack-based auto variables. It is a great pain to work with even the plain C strings.
- There is no signed division operation support in either the compiler toolchain or the BPF instruction set5.
- There is no floating-point number support6.
I’ll stop here since the list can still go on and on. We often joke that writing nontrivial eBPF C code is much more convoluted than writing kernel C code, considering that most people think kernel C hacking is very hard-core. Fortunately, our eBPF+ implementation used by Ylang addressed almost all of the limitations listed above, and the Ylang compiler can write such convoluted eBPF C code automatically for us. We can write natural and clean C without thinking about those bloody details at all.
Still, the standard eBPF toolchain also requires a separate user-land program written in languages like Python and C (most people use Python, though). It is a worse burden than the shell wrappers for tools written in SystemTap’s scripting language. Luckily, the Ylang compiler can also emit such user-land programs automatically. (Ylang emits optimized C code for such programs since Python is bloated and slow.)
GDB/LLDB: Not Like C At All
We’ll have an even harder time using a language very different from the C syntax to write tools to analyze C/C++ applications. Such examples are GDB and LLDB. GDB provides the Python and Scheme languages to write new extensions. And LLVM provides Python. You may think that using Python to trace Python applications will feel natural, that is not the case! Such GDB Python code always analyzes things written in low-level languages like C! This leads to horrible Python code for even simple C logic. For example, let’s consider the following simple C statements
int a = *(int *) my_var;
where my_var is a variable in the target process. Then to turn it into a proper GDB Python code snippet, we’ll have
sym_my_var = gdb.lookup_global_symbol("my_var")
if sym_my_var is None:
    sym_my_var, _ = gdb.lookup_symbol("my_var")
a = sym_my_var.value().cast(gdb.lookup_type("int").pointer()).dereference()
In Ylang, you can write the former form and declare the target variable my_var like this:
_target long *my_var;
Note that the _target keyword is a new extension in Ylang, indicating a symbol in the target software.
Things can get worse very quickly with GDB Python when the complexity accumulates. Let’s see a bloody example in one of our hand-crafted GDB Python scripts. It’s something in my worst nightmare.
Luckily even the Ylang compiler does not have to generate the lengthy and slow Python code listed above. It can emit much more compact code bypassing the cumbersome gdb.Value objects, which have the following benefits:
- The resulting Python code is significantly faster at runtime (sometimes times faster).
- The resulting code is also much smaller since it’s much more compact.
- The resulting code no longer requires DWARF data to be present in the target environment (and thus, we call it DWARF-less).
Still, the Ylang compiler can emit the slow form used almost exclusively by human users to compare these two different forms.
To Be Continued
This post is already long. Starting with Part 2, we will focus more on the features and examples of Ylang.
About The Author
Yichun Zhang (Github handle: agentzh), is the original creator of the OpenResty® open-source project and the CEO of OpenResty Inc..
Yichun is one of the earliest advocates and leaders of “open-source technology”. He worked at many internationally renowned tech companies, such as Cloudflare, Yahoo!. He is a pioneer of “edge computing”, “dynamic tracing” and “machine coding”, with over 22 years of programming and 16 years of open source experience. Yichun is well-known in the open-source space as the project leader of OpenResty®, adopted by more than 40 million global website domains.
OpenResty Inc., the enterprise software start-up founded by Yichun in 2017, has customers from some of the biggest companies in the world. Its flagship product, OpenResty XRay, is a non-invasive profiling and troubleshooting tool that significantly enhances and utilizes dynamic tracing technology. And its OpenResty Edge product is a powerful distributed traffic management and private CDN software product.
As an avid open-source contributor, Yichun has contributed more than a million lines of code to numerous open-source projects, including Linux kernel, Nginx, LuaJIT, GDB, SystemTap, LLVM, Perl, etc. He has also authored more than 60 open-source software libraries.
-
eBPF C developers should be familiar with the Clang compiler error “defined with too many args.” ↩︎
-
Such missed relocations could lead to NULL-pointer deference at runtime, which may result in kernel panics. ↩︎
-
eBPF C developers should be familiar with the Clang compiler error “functions with VarArgs or StructRet are not supported.” ↩︎
-
A VMA tracker maps relative addresses in the target processes to absolute virtual memory addresses and vice versa. ↩︎
-
eBPF C developers should be no stranger to the Clang compiler errors like “Unsupport signed division for DAG” and “error in backend: Cannot select: 0x55ba75efac30: i64 = sdiv”. ↩︎
-
Many dynamic tracing frameworks lack floating-point number support. The only exceptions are SystemTap (it got the feature recently), GDB Python, and DTrace on Solaris (DTrace ports on other operating systems still lack it). ↩︎
Related Articles
OpenResty XRay Dec 31, 2021

OpenResty XRay Dec 28, 2021

OpenResty XRay Nov 14, 2021

OpenResty XRay Apr 4, 2024

OpenResty XRay Nov 24, 2023
")


")
")
")


")